5.3.3 APPX Application Design Manual

+ Chapter 1-1: Overview of Application Design
+ Chapter 1-2: Getting Started
+ Chapter 1-3: Data Dictionary
+ Chapter 1-4: Understanding Process Design
+ Chapter 1-5: Interprocess Communication
+ Chapter 1-6: Customizing Your Application
+ Chapter 1-7: The Documentation Facility
+ Chapter 1-8: Application Design Tools
+ Chapter 2-1: Data Dictionary Overview
+ Chapter 2-2: Data Dictionary Concepts
+ Chapter 2-3: Domains
+ Chapter 2-4: Files and Fields
+ Chapter 2-5: Work Fields
+ Chapter 3-1: Overview of APPX Processes
+ Chapter 3-2: Getting Started
+ Chapter 3-3: Process Definition
+ Chapter 3-4: Menu Processes
+ Chapter 3-5: Job Processes
+ Chapter 3-6: Input Processes
+ Chapter 3-7: Output Processes
+ Chapter 3-8: Update Processes
+ Chapter 3-9: Query Processes
+ Chapter 3-10: Inquiry Processes
+ Chapter 3-11: Status Processes
+ Chapter 3-12: Subroutine Processes
+ Chapter 3-13: Table Processes
+ Chapter 3-14: Automatic and Optional Children
+ Chapter 3-15: Using the Image Editor
+ Chapter 3-16: Using GUI Features of the Image Editor
+ Chapter 3-17: Using Event Points
+ Chapter 4-1: ILF Integration
+ Chapter 4-2: True/False Status Indicators
+ Chapter 4-3: Specifying Statements
+ Chapter 4-4: The ILF Editor
- Chapter 4-5: The Appx ILF Debugger
+ Chapter 4-6: ILF Keyword Reference
+ Chapter 4-7: Predefined Fields
+ Chapter 4-8: Runtime Subroutine's and Predefined Processes
+ Chapter 4-9: Appx Chart Director API

Chapter 4-5: The Appx ILF Debugger

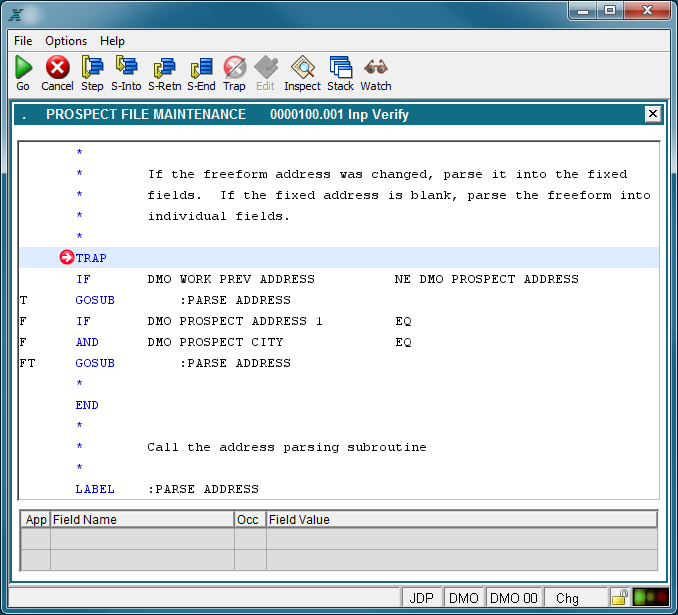
Main Debugger Window


The main window of the ILF debugger displays the ILF statements which precede and follow the next line to be executed.  If the ILF debugger is displayed as the result of encountering a TRAP statement, the next line to be executed will be the TRAP statement. In the example below, the TRAP statement is highlighted with a light blue background.  The white arrow in the red circle points to the statement to further hightlight it.

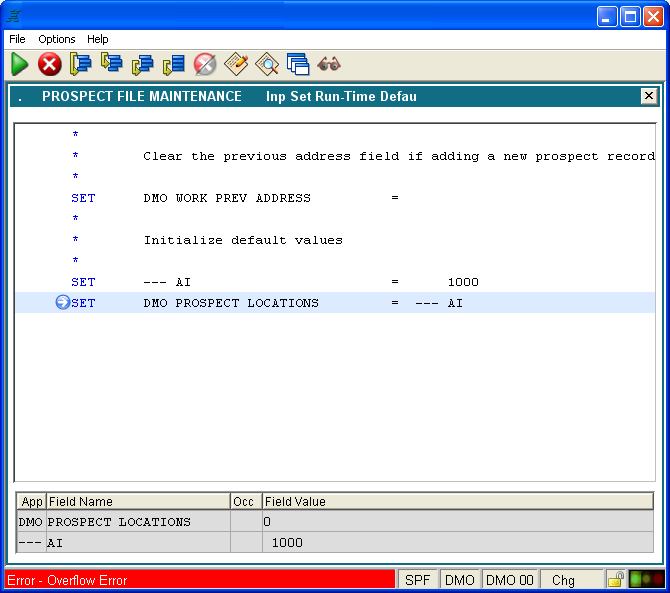
ILF Debugger

If a runtime error causes the ILF debugger to be invoked, the statement which caused the error will be highlighted with a light blue background color.  The white arrow in the blue circle points to the statement to further hightlight it. In the example below, notice that the value for the fields for the current statement are displayed in the field value window on the bottom of the screen.

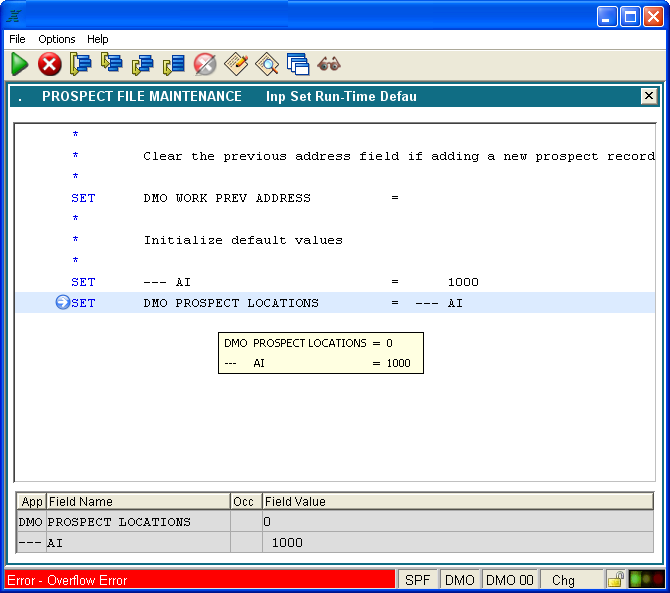
ILF Debugger

Field values can also be viewed in a popup tooltip by moving the mouse pointer over any ILF statement which references a field.

ILF Debugger

Application Design Manual                                         "Powered by Appx Software"

929

©2006 By APPX Software, Inc. All Rights Reserved